Pivot Viewer
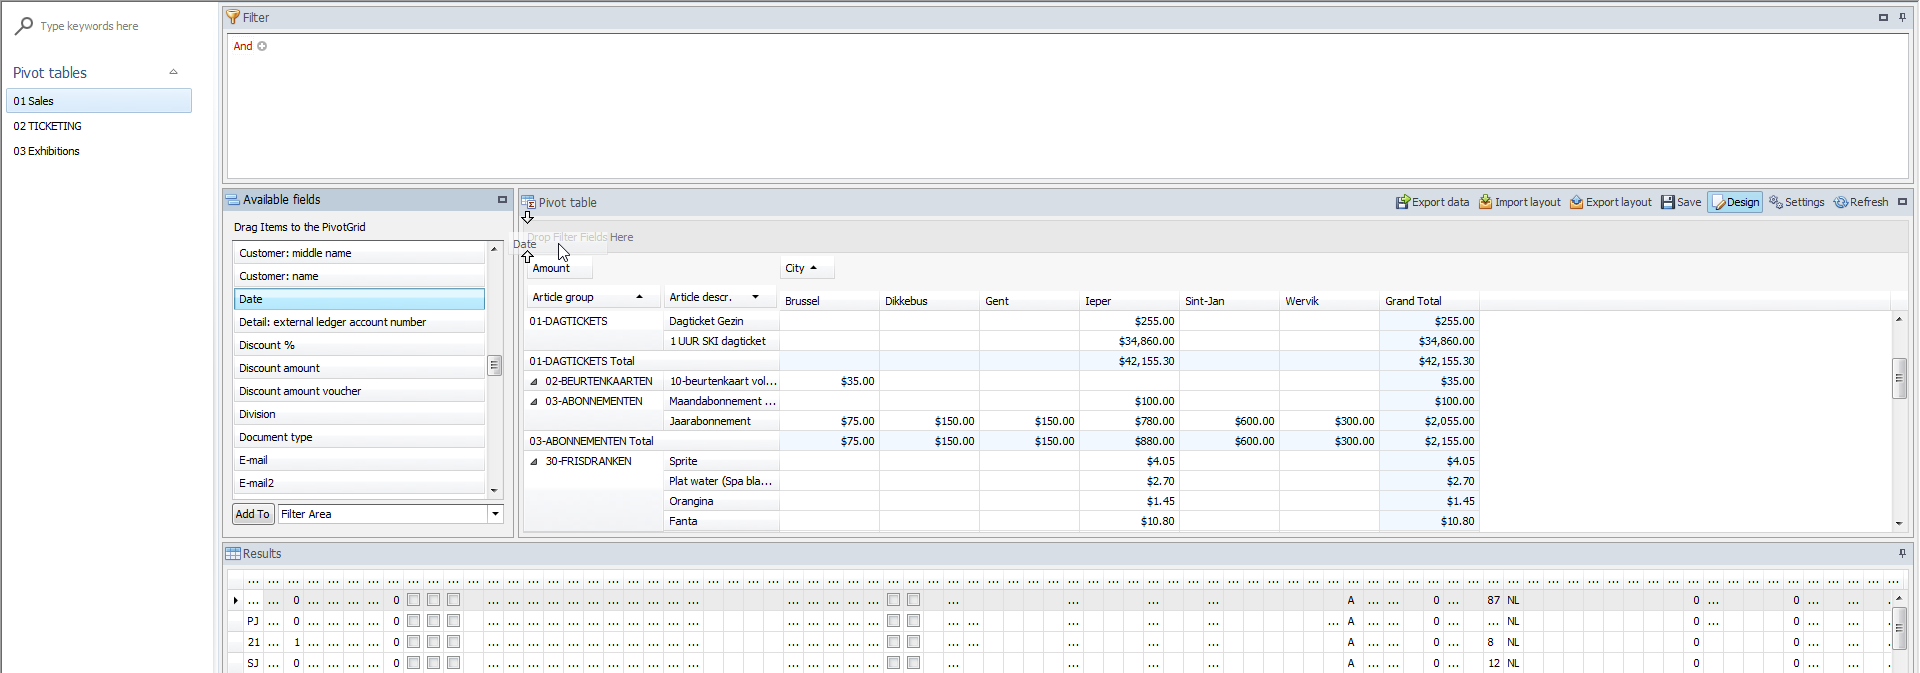
In the Pivot viewer (Reporting > Pivot tables > View) you have the available pivots on the left panel and the visualisation of the active pivot on the right in the data window.
 |
Side panel
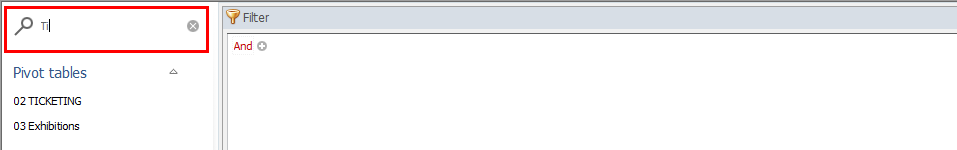
By using the search bar on the top of the left panel, it is possible to search for specific pivots by name.
 |
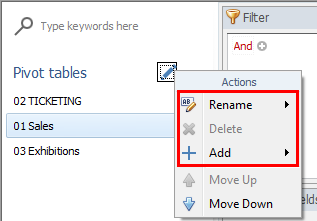
With a right-click in the header of the menu, you can set the menu to Design mode.
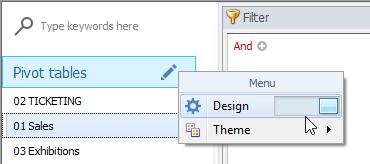 |
Note
Note an edit icon will appear when design mode is activated.
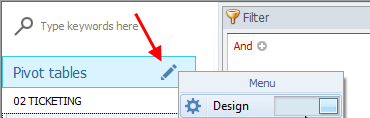 |
In design mode you can add, remove, rename categories.
Click  to evoke the edit menu.
 |
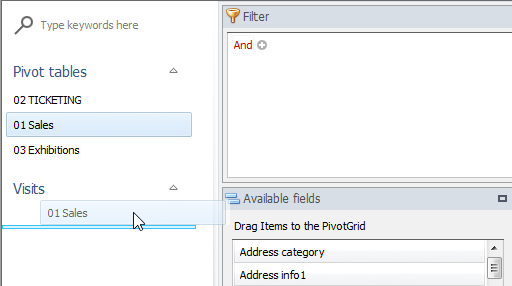
You can change the order and categories of the pivots by dragging and dropping them.
 |
Data Window
The window displaying the active pivot contains four partial windows (Filter, Available fields, Pivot table and Results) that you can move according to your wish. In order to move a partial window, you have to click on the title bar and drag the window to the desired position (drag and drop).
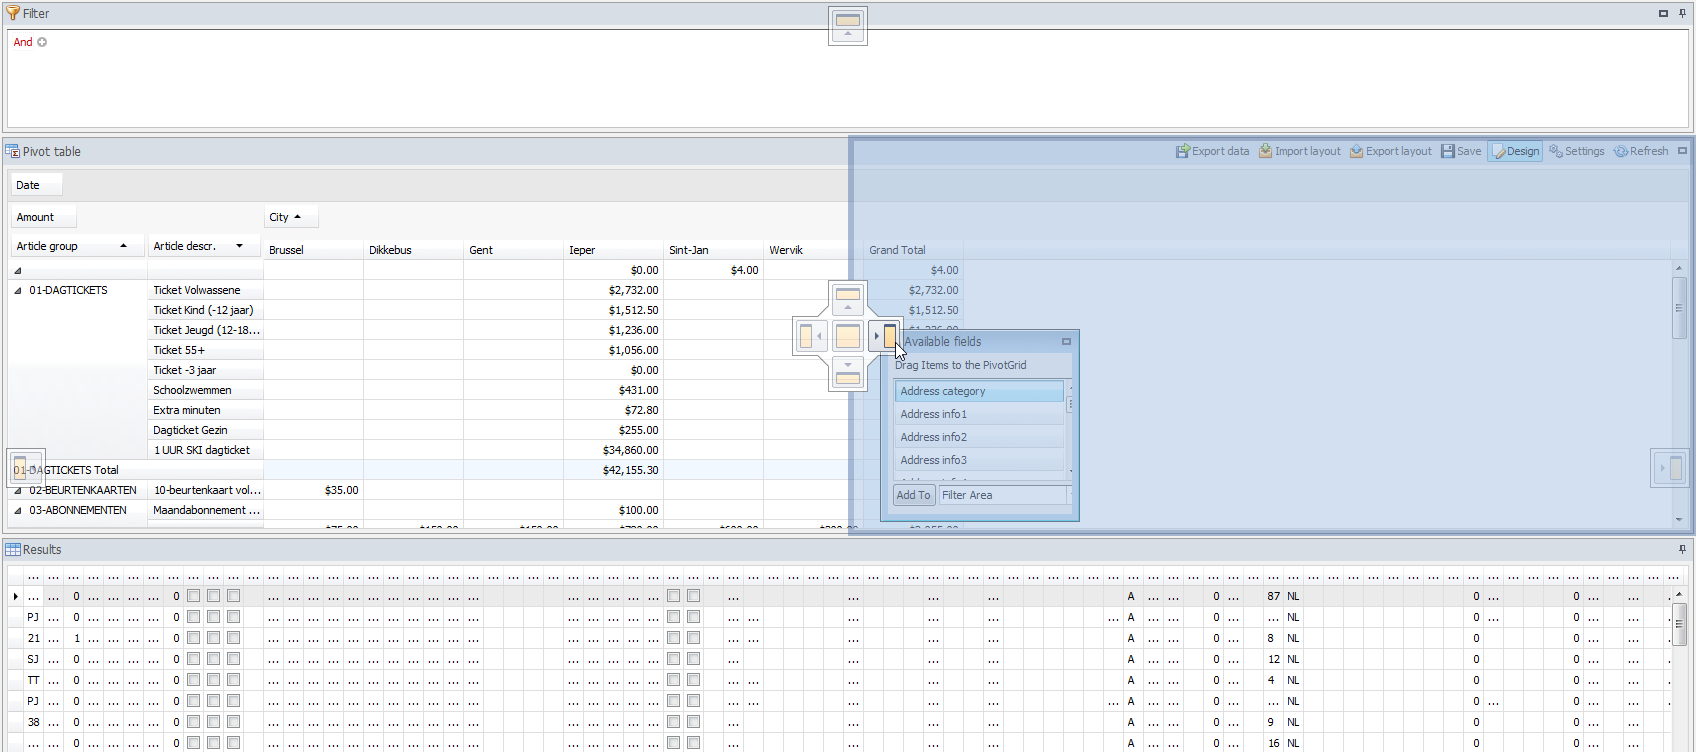 |
You can choose to place the separate partial windows (Filter, Available fields, Pivot table and Results) as separate windows on the detailed window or you can add them to the window with detailed data by dragging them on one of the docking points.
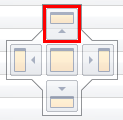
Dependent on where you drag the partial window on the docking tool, the window will be positioned in the window with detailed data.
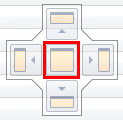
| If you place the partial window on this position of the docking tool, the partial window will take up the entire window of detailed data. | |
| If you place the partial window on this position of the docking tool, the partial window will take up the upper half of the window of detailed data. | |
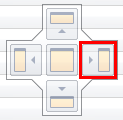
| If you place the partial window on this position of the docking tool, the partial window will take up the right half of the window of detailed data. | |
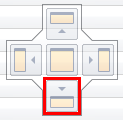
| If you place the partial window on this position of the docking tool, the partial window will take up the lower half of the window of detailed data. | |
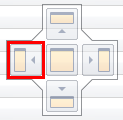
| If you place the partial window on this position of the docking tool, the partial window will take up the left half of the window of detailed data. |
Warning
If you do not succeed in dragging a partial window, it is probably due to the fact that the window is currently pinned. If required, first click on  .
.
Pivot Table
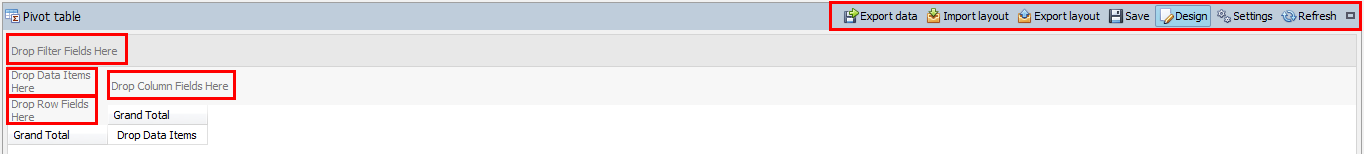 |
The partial window Pivot table contains:
Filter area (optional)
The filter area allows you to limit the content of the entire pivot table to a certain area. For more information, see set up a filter.
Data area
The area for data items is generally used for putting data that contain ciphers. Here you can drag the field that you want to summarize. After adding a field to the data area, you can click this field with the left mouse button to choose another summary (Count, Sum, Min, Max, Average, ...).
Row area
By using row areas you can make a selection from the entire data file. Here you can drag the fields you want to group vertically.
If you, for example, drag the field Customer group here, a row will be created for each customer group. The field you have dragged in the data area will then be summarized per customer group.
If you drag several fields here, several group levels will be created. If you, for example, also add the field Customer, a summary will be made per customer within each customer group.
If you have chosen more than one field, you can maximize and minimize the groups in order to see the summary on the desired level.
Column area
By using column areas you can make a selection from the entire data file. Here you can drag the fields you want to group horizontally. Analogous to row area.
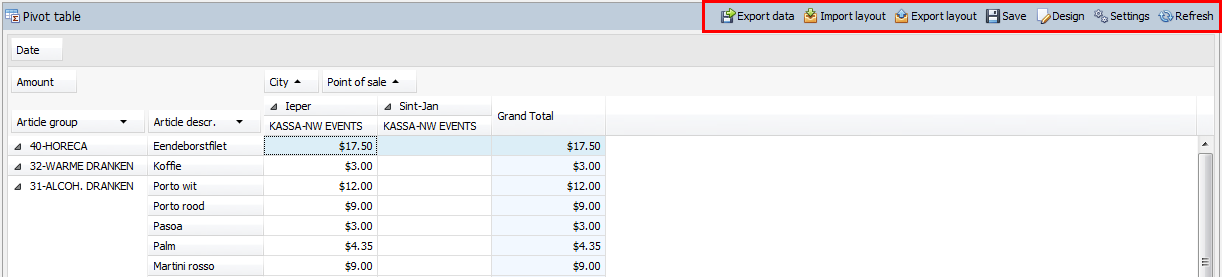
Menu bar
The menu bar shows all the available menu items for the active pivot. For description on the menu items, see Menu bar.
Menu Bar
 |
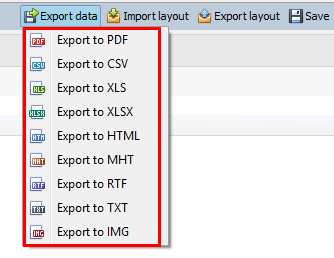
| Export the data to one of the supported formats (PDF, CSV, XLS, …)
| |
| Import a previously exported layout. | |
| Export the layout to a file (this allows you to copy pivots to other databases). | |
| Save the pivot in the database. | |
| When enabled, only loads the first 100 records. This increases performance when configuring the pivot table. Disable the design mode the moment you want to visualise the actual data. | |
| Contains various setting options for the active pivot table. For configuring the settings, see the section Settings. | |
| Reload the data in the pivot table. |


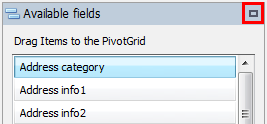
Available Fields
If you want to create a view yourself, you have to drag the desired fields in the pivot table. All available fields within the chosen view category can be consulted in the partial window Available fields.
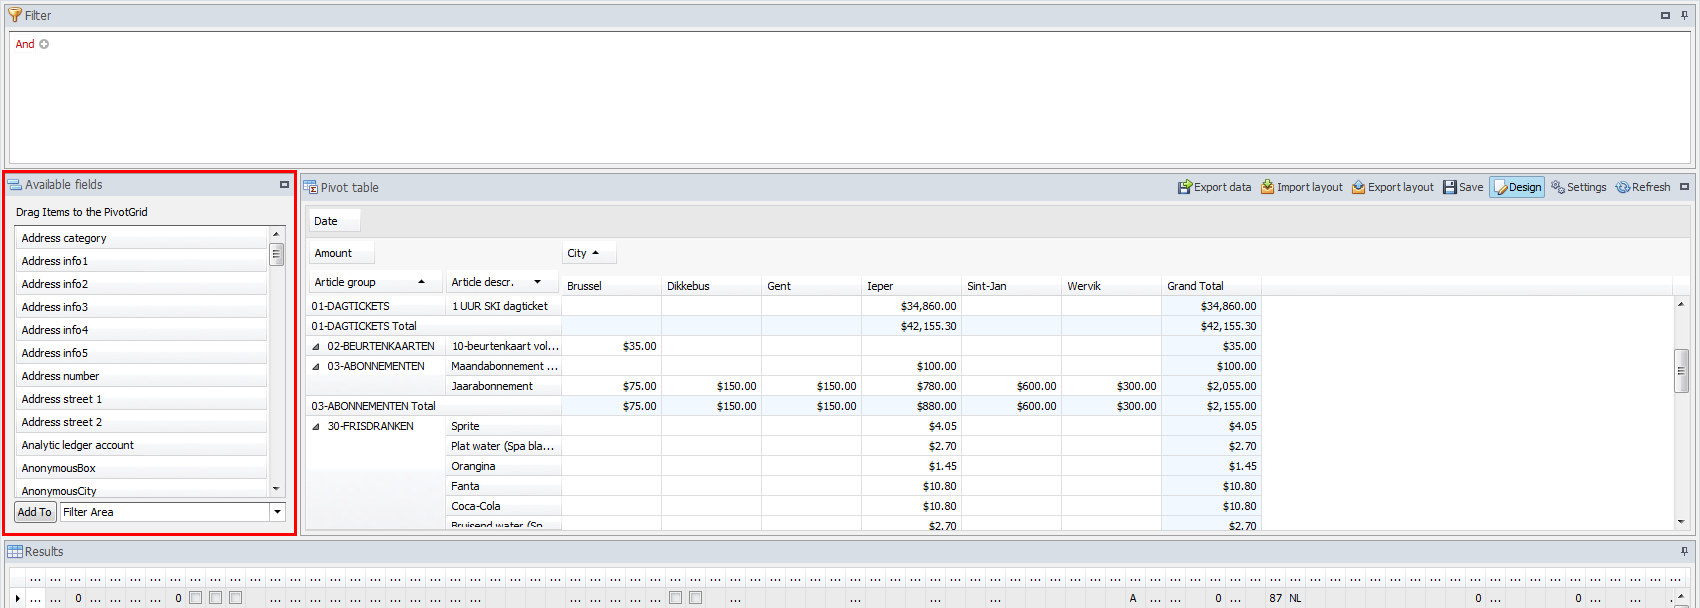 |
Here, you can also use the  button in the top-right corner of the window to expand or minimize the Available fields window.
 |
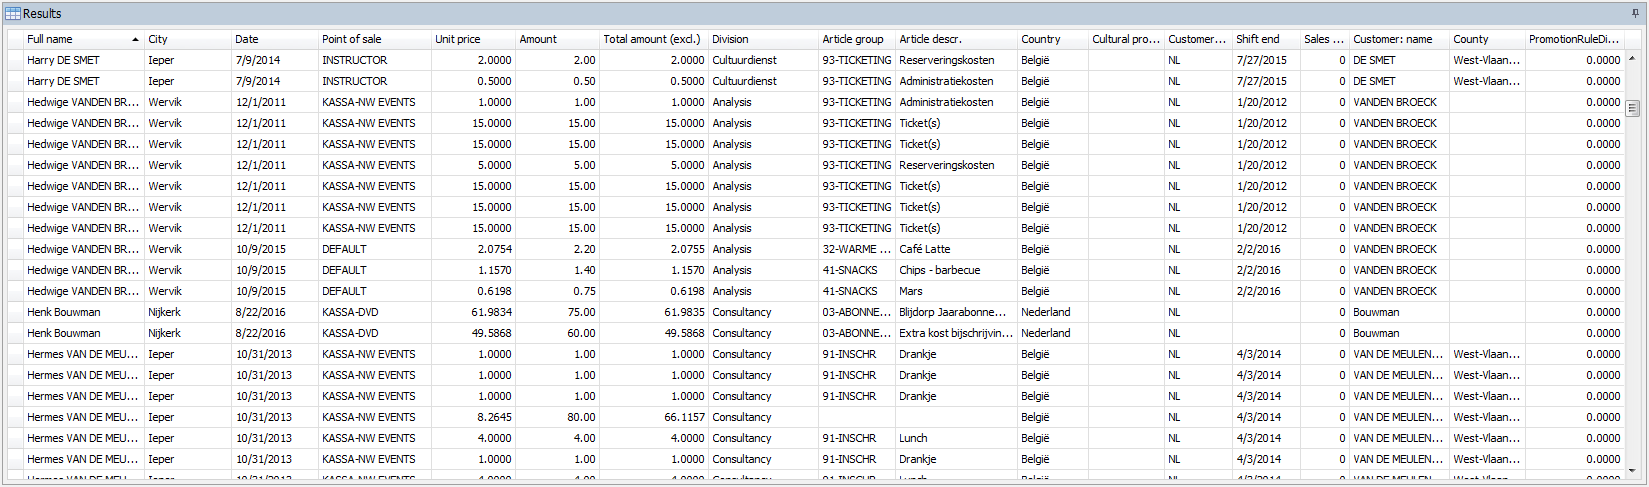
Results
The Results window shows all data that is available in the data source with the applied filter.
You can change the width of the columns to see which data is in which columns before configuring the pivot itself.
 |
Note
In case of a large number for column fields, you might be required to remove some of the fields in order to expand the columns.