Create a view
If you want to create a new view, it is advised to respect a number of steps. As a first step, it is necessary to select a view category and to make it visible by clicking on  . Then, click on
  in the tool bar. The window below will appear.
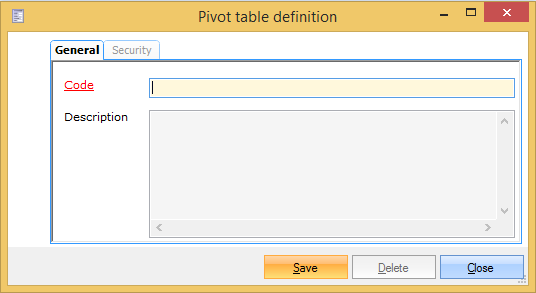 |
Code | Is unique and mandatory. It is advised to choose a relevant code so that you can immediately derive from the code which view is concerned. |
Description | Here you can fill in an additional description of the view. |
Create a pivot table
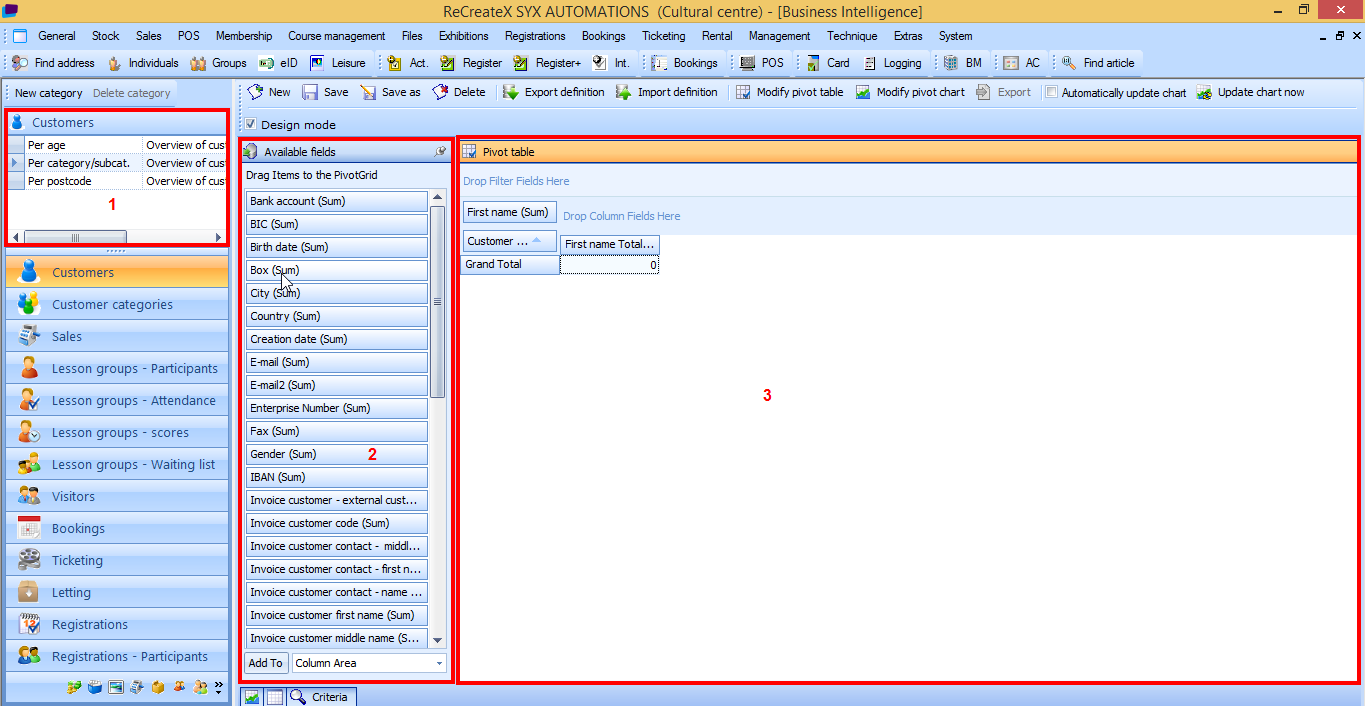
If you want to create a pivot table, you first have to select the desired view (1) and then make the available fields visible (2). These available fields then have to be dragged to the different fields of the pivot table (3).
 |
Setup pivot table
A pivot table allows you to organize, summarize and analyse data to clarify their meaning.
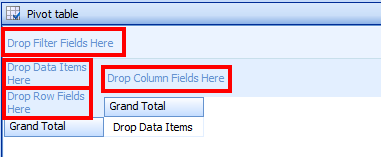 |
A pivot table contains:
Filter area (optional)The filter area allows you to limit the content of the entire pivot table to a certain area.
Data areaThe area for data items is generally used for putting data that contain ciphers. Here you can drag the field that you want to summarize. After adding a field to the data area, you can click this field with the left mouse button to choose another summary (Count, Sum, Min, Max, Average, ...).
Row areaBy using row areas you can make a selection from the entire data file. Here you can drag the fields you want to group vertically.If you, for example, drag the field Customer group here, a row will be created for each customer group. The field you have dragged in the data area will then be summarized per customer group.If you drag several fields here, several group levels will be created. If you, for example, also add the field Customer, a summary will be made per customer within each customer group.If you have chosen more than one field, you can maximize and minimize the groups in order to see the summary on the desired level.
Column areaBy using column areas you can make a selection from the entire data file. Here you can drag the fields you want to group horizontally. Analogous to row area.
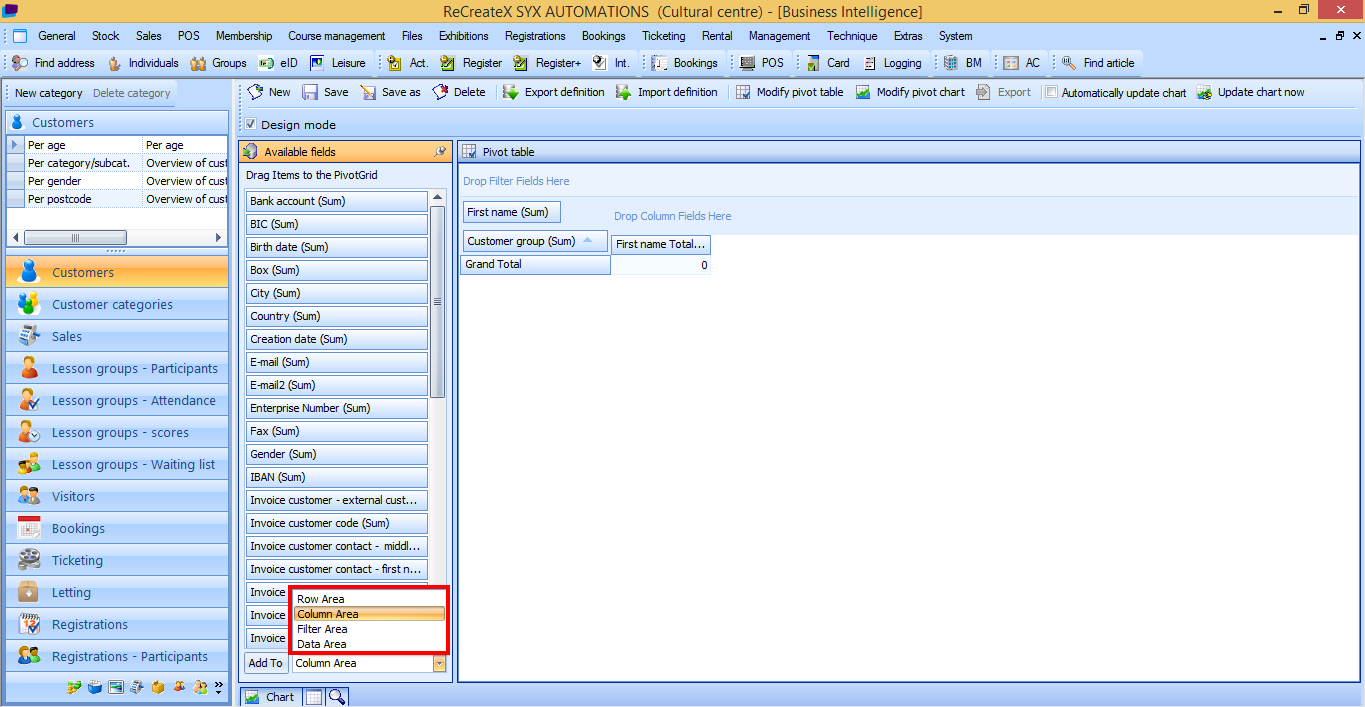
Set up a pivot table
You have to place the desired available fields in the correct area of the pivot table by selecting the desired field and dragging it towards the desired area (drag and drop), or by selecting the desired field and choosing the area at the bottom of the window Available fields and clicking on Add To.
 |
After setting up the pivot table, you still have to save it by clicking on Save .
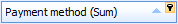
Set up a filter
There are two ways to set up a filter. The easiest way is by placing the desired filter fields on your pivot table in the row, column or filter area and by clicking on the filter icon afterwards to set up the filter.
 |
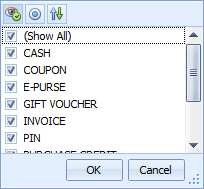
You will then be able to select or deselect all rows, columns or other filter conditions you want to see or not.
 |
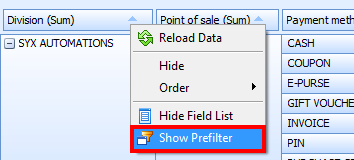
If this is not sufficient, however, you can always use the second way. For this, you have to click the right mouse button in the row, column or filter area and choose Show Prefilter.
 |
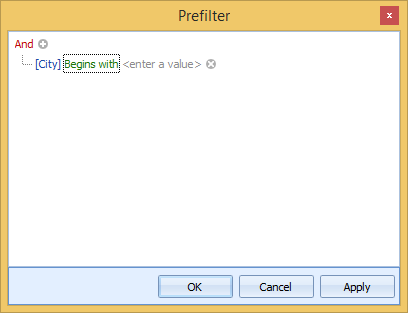
The Prefilter window will appear in which you can define the different conditions of the filter:
 |
 | Add a new condition to this group. | |
 | Delete this condition. | |
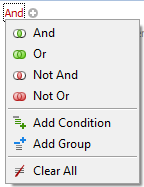
 | If you click this option you can determine the relation between the conditions. Here you can also add a new group or condition, as well as delete the entire filter.
| |
 | This is the field on which you want to apply the filter. If you click on this field, all fields that are available for the filter will appear. | |
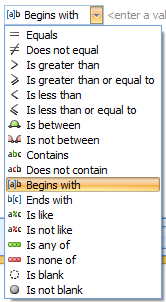
 | Here you can determine the condition of the field.
| |
 | Here you can fill in the value that has to be met by the chosen field. |