Quick Tutorial
In principle, the procedure for using the Dashboards is as follows:
Note
Pre-configured dashboards can be availed on request from GANTNER CSC agents.
Configure Data Source
Go to Reporting > Data sources to create a new data source (F2).
Configure the data source Details and Connection data.
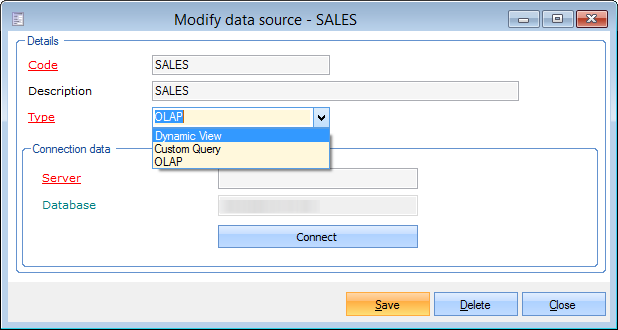 |
For more information on the available types of data sources, see Data sources.
Configure Dashboards
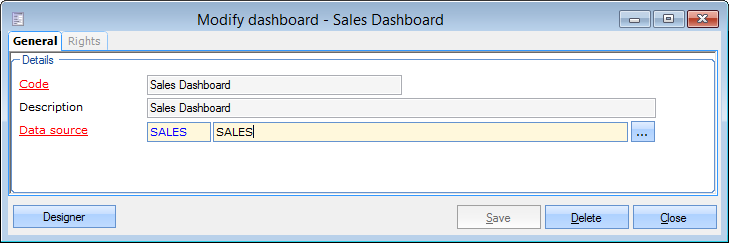
Go to Reporting > Dashboards > Configure to create a dashboard (F2).
On the tab General, you can configure a code, a description and the data source to be used.
Click Save.
 |
Note
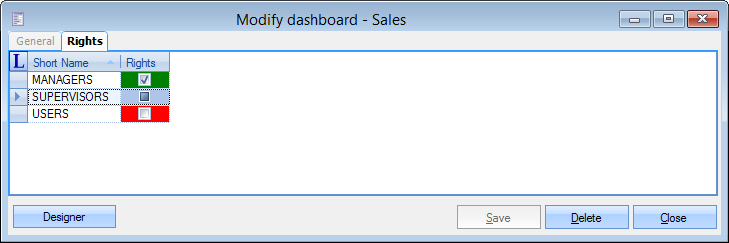
On the tab Rights, you can configure rights to view and/or edit the dashboard for each user group (No access  , read-only
  , full control
  ).
).
 |
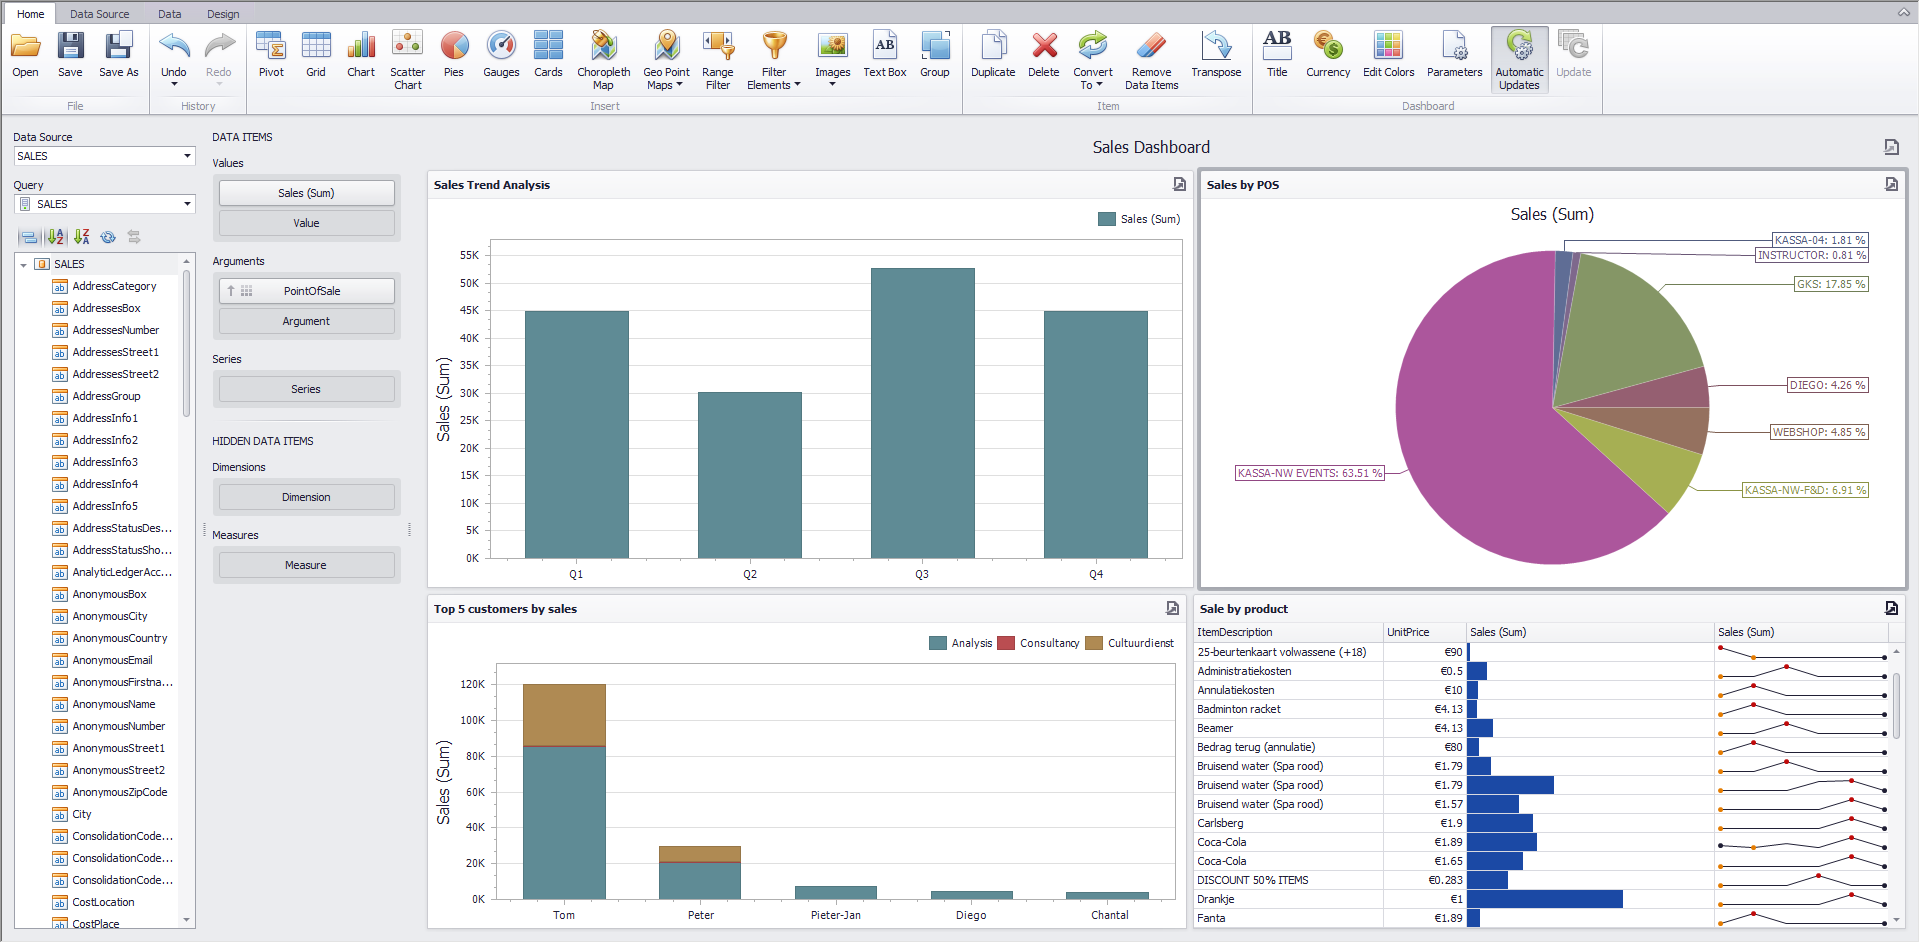
Click Designer to begin configuring the dashboard.
On the resulting screen, click on the desired dashboard item from the Home ribbon to add it on the dashboard.
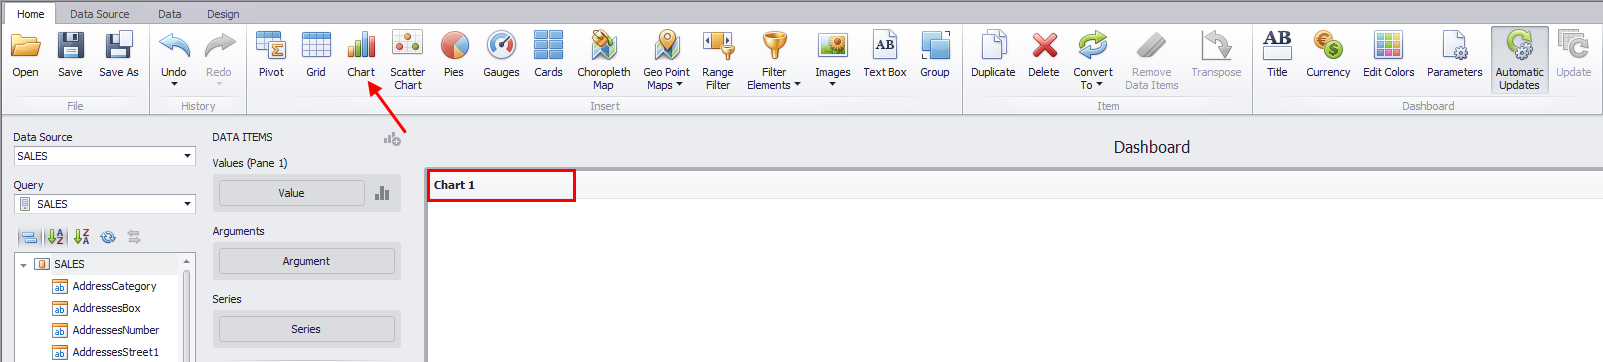 |
For more information on working with dashboard items, refer to the section Dashboard Items.
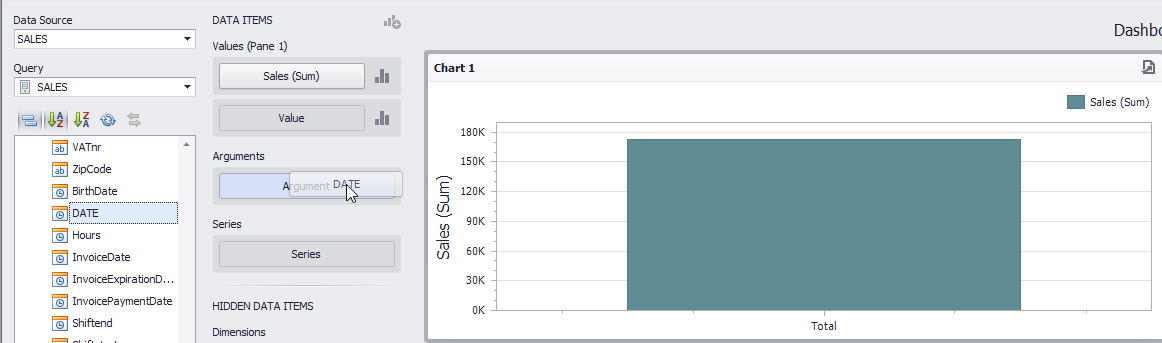
Select the values you want to show by dragging the field(s) from the Data source to the fields in Data items.
Note
Each of the dashboard items used for creating a visual representation of data, retrieves data from data source. Retrieving large data can lead to performance issues. Therefore, it is advised to set your filters before starting to build your dashboard.
It is possible to filter view using Filter Elements, Dashboard Parameters and Conditional Formatting.
For more information, see Creating Dashboard Items and Binding to Data.
 |
It is possible to add multiple dashboard items, link them with data and change the title of the graphs and dashboard to create the desired dashboard view.
 |
Warning
When using data source type Dynamic View or Custom Query, if the design mode is enabled, only the first 100 records will be loaded. This is done to improve performance while designing.
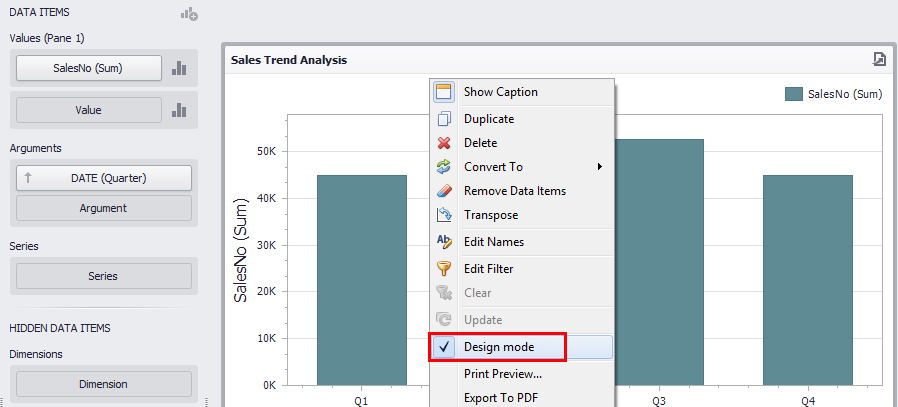 |
However, when the design mode is disabled or the dashboard is consulted from the Dashboard viewer, all the records are loaded.
For more information on dashboard controls and configuring dashboard items, refer Dashboard Designer.
Click Save in the Home ribbon to save the configured dashboard.
View Dashboards
To consult the configured dashboards, go to Reporting > Dashboards > View.
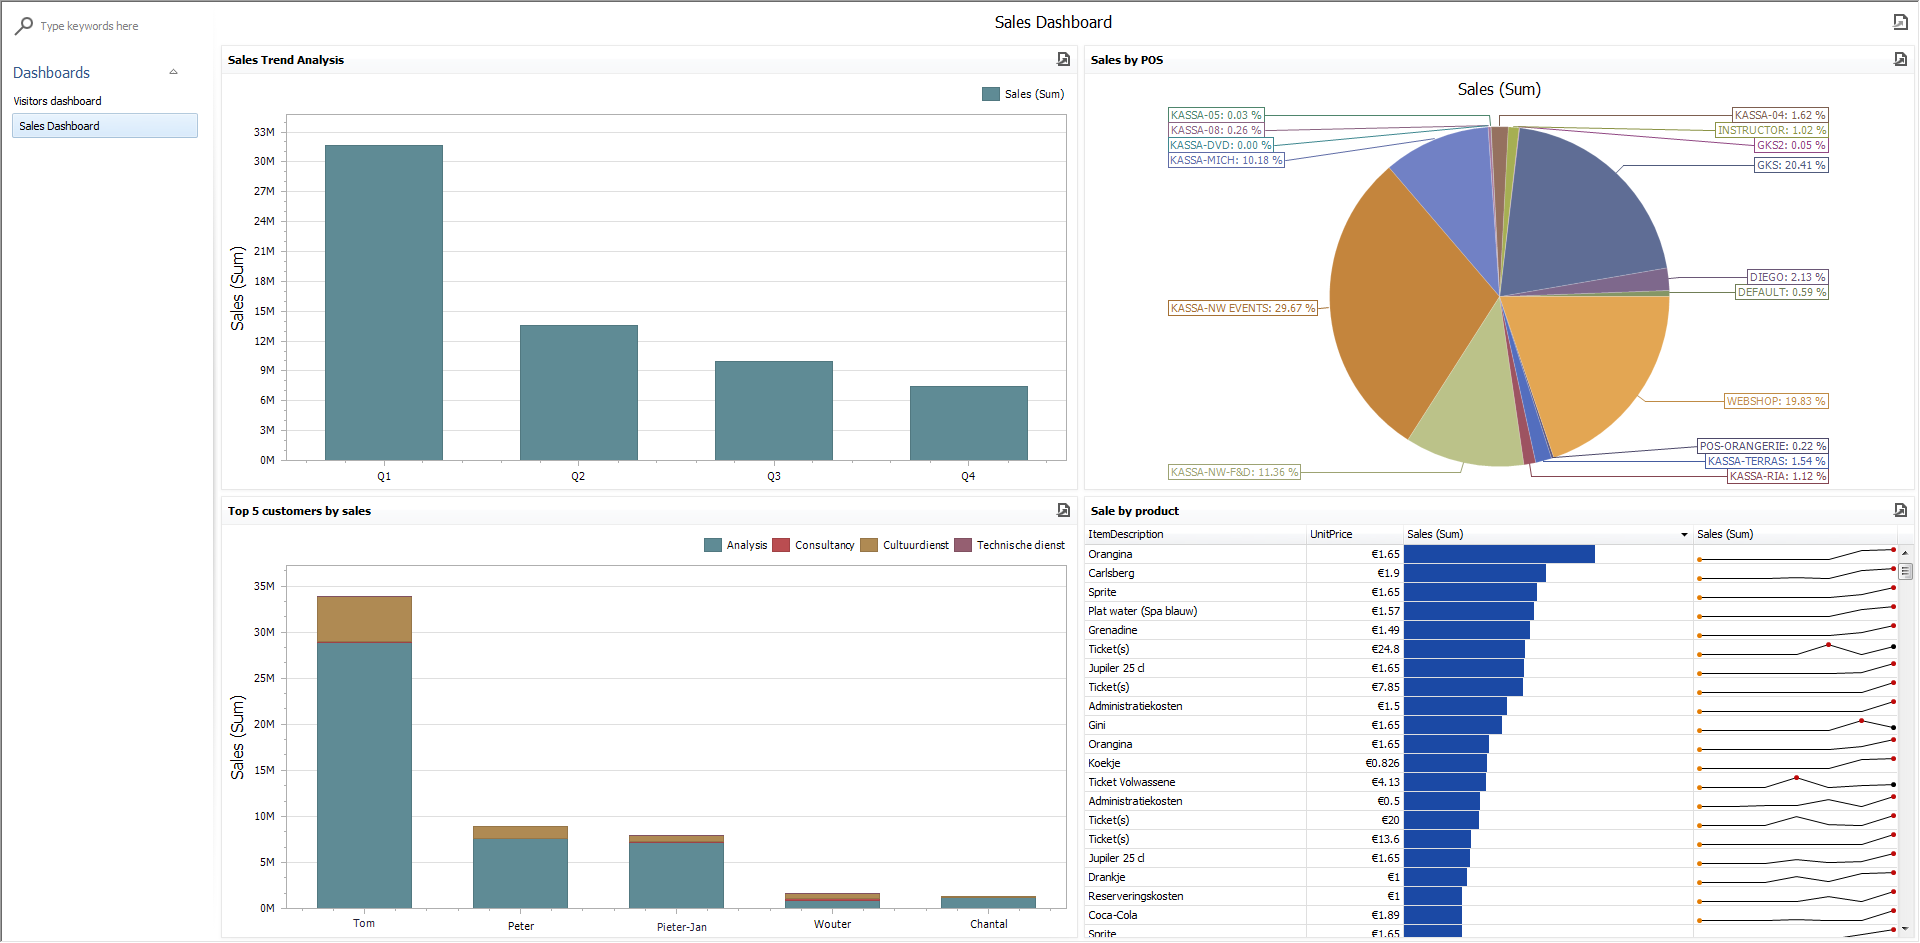 |
For information on the interactions and controls available on Dashboard Viewer, see Dashboard Viewer.