Modify a Pivot Table
After creating a pivot table, you can modify the pivot table using the Settings option available in the menu bar.
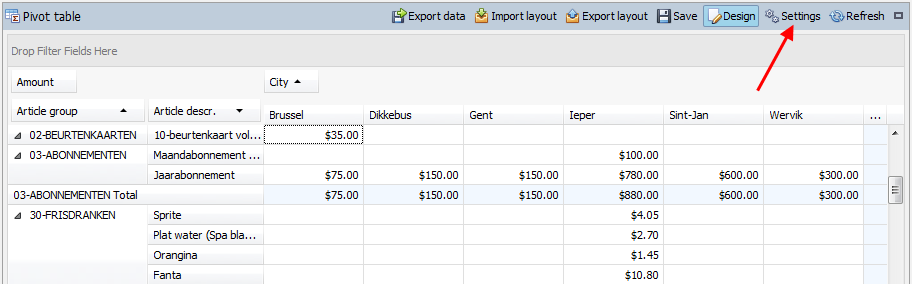 |
This will evoke the Settings window.
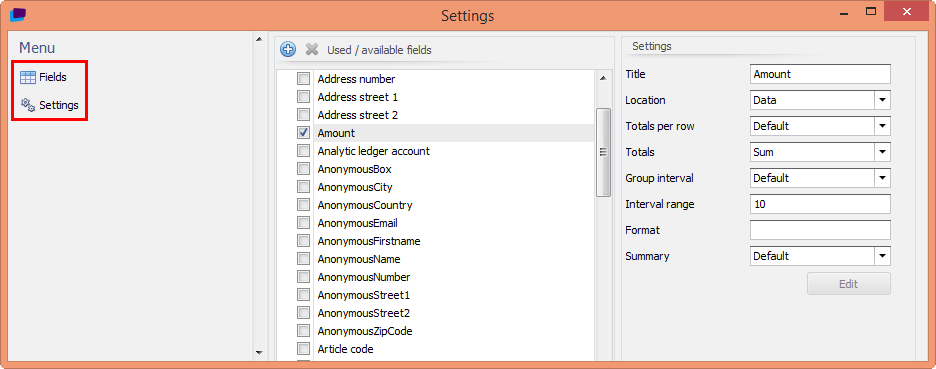 |
From the left column of the Settings window, you can choose to modify the following for the pivot table:
Fields
In the window Settings you can choose for Fields in the left column of the window. Here you can modify the entire pivot table.
In the section Settings, you can modify the settings for the field that is selected from the section Used / available fields.
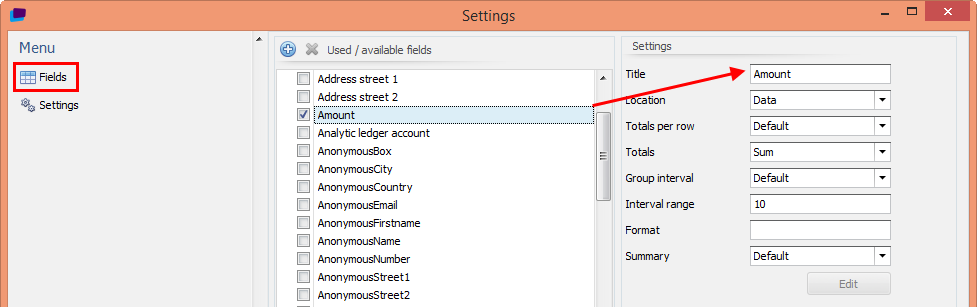 |
Title | Modify the label of the selected field. |
Location | Determines in which area (rows, columns, filter, ...) the selected field has to be placed. |
Totals per row | By default the row totals are shown (Default) it is possible to hide the row totals for each field by setting this to None. |
Totals | Allows to determine the way in which the totals have to be calculated. |
Group interval and Interval range | Group interval and Interval range allows you to define an interval of the selected field. |
Format | Allows to determine the way the format of the field data. For example, entering a c will set the value as a currency. Entering Nx will set the value as a number with x decimals. AnmerkungThe currency symbol is taken automatically from the localisation settings of the ReCreateX user. |
Summary | Determines whether the data is visualised in another way (as percentages or absolute values) than the default way. |
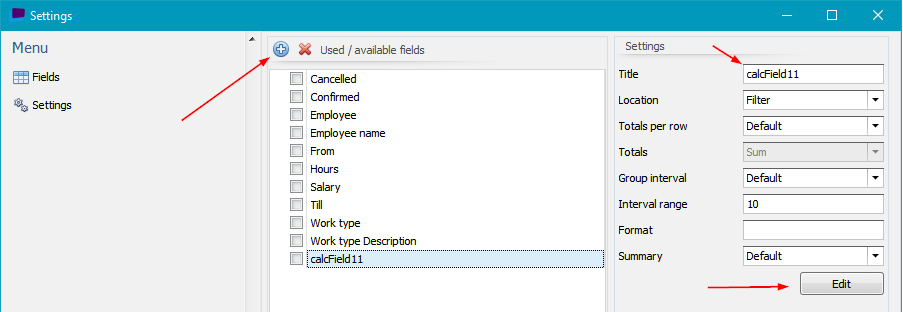
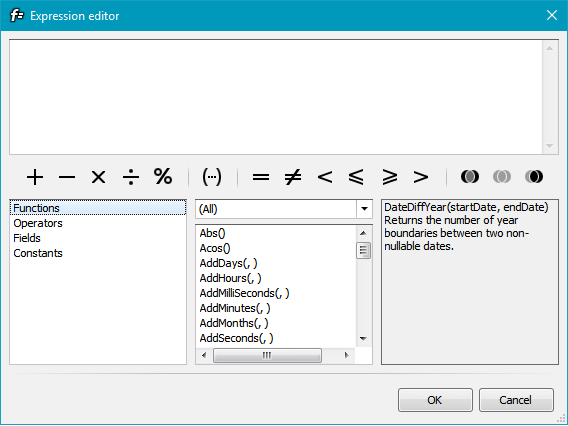
If you need an extra field that is not available in the database, you can add a calculated field by clicking the blue + button  . Click the Edit button to access the Expression editor where you can determine the contents of the calculated field.
 |
 |
Settings
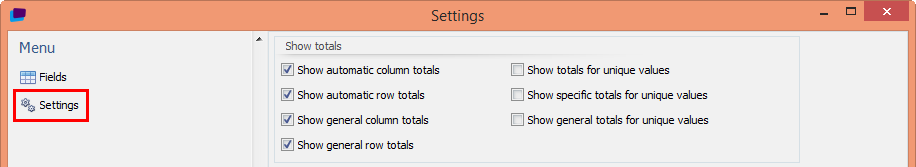
Show automatic column totals | If several values are available per column, you can visualise a total of the values within this column. |
Show automatic row totals | If several values are available per row, you can visualise a total of the values within this row. |
Show general column totals | If several columns are available, you can visualise a total of these columns. |
Show general row totals | If several rows are available, you can visualise a total of these rows. |
Show totals for unique values | If the option Show automatic column totals or Show automatic row totals is ticked, and if there is only one value available in the column or row, you have to tick this option to see the total anyway. |
Show specific totals for unique values | If you work with specific values (minimum, maximum, average), it is possible to visualise the totals by ticking this option. |
Show general totals for unique values | If the option Show general column totals or Show general row totals is ticked, and if there is only one value available in the column or row, you have to tick this option to see the total anyway. |