Modify a pivot table
After creating a view and a pivot table, there are always certain settings by means of which you can modify the pivot table.
 |
Settings
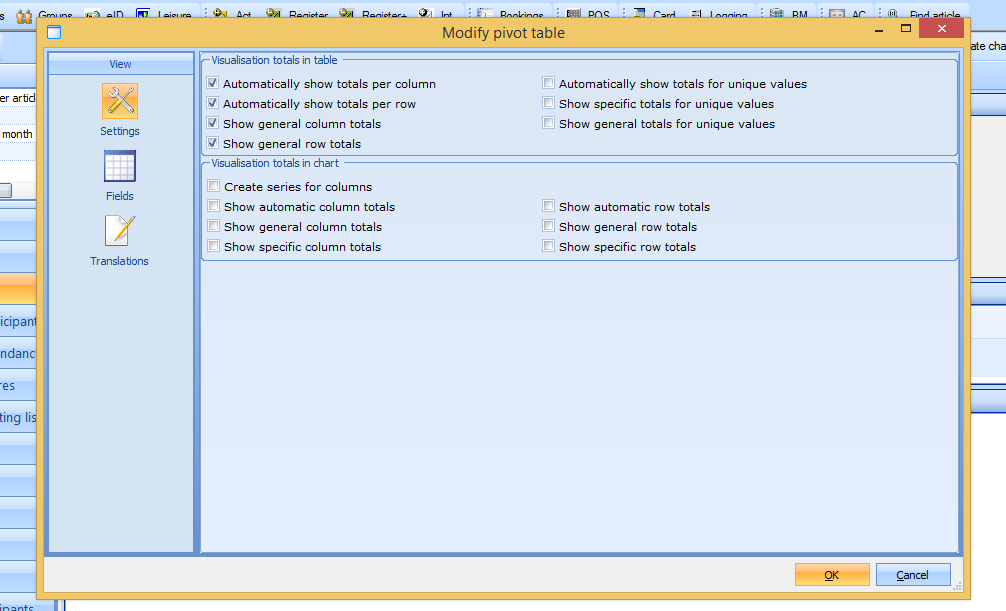
In the window Modify pivot table you can choose the Settings of the pivot table in the left column of the window.
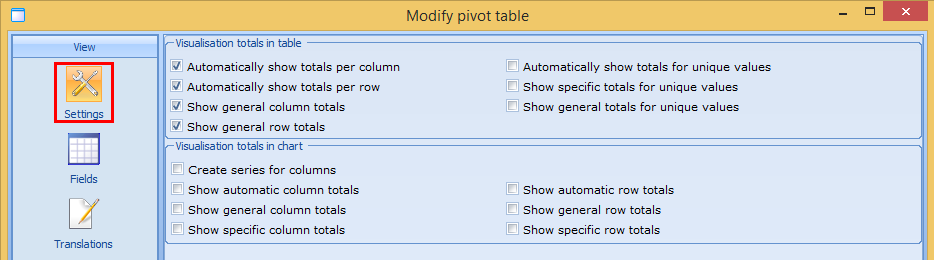 |
The options in the section Visualisation totals in table apply to the pivot table:
Automatically show totals per column | If several values are available per column, you can visualise a total of the values within this column. |
Automatically show totals per row | If several values are available per row, you can visualise a total of the values within this row. |
Show general column totals | If several columns are available, you can visualise a total of these columns. |
Show general row totals | If several rows are available, you can visualise a total of these rows. |
Automatically show totals for unique values | If the option Automatically show totals per column or Automatically show totals per row is ticked, and if there is only one value available in the column or row, you have to tick this option to see the total anyway. |
Show specific totals for unique values | If you work with specific values (minimum, maximum, average), it is possible to visualise the totals by ticking this option. |
Show general totals for unique values | If the option Show general column totals or Show general row totals is ticked, and if there is only one value available in the column or row, you have to tick this option to see the total anyway. |
The options in the section Visualisation totals in chart apply to the chart:
Create series for columns | With this option you can determine if you want to change the X and Y axes. |
Show automatic column totals | If several values are available per column, you can visualise a total of the values within this column. |
Show general column totals | If several columns are available, you can visualise a total of these columns. |
Show specific column totals | If you work with specific values (minimum, maximum, average) in the columns, it is possible to visualise the totals by ticking this option. |
Show automatic row totals | If several values are available per row, you can visualise a total of the values within this row. |
Show general row totals | If several rows are available, you can visualise a total of these rows. |
Show specific row totals | If you work with specific values (minimum, maximum, average) in the rows, it is possible to visualise the totals by ticking this option. |
Fields
In the window Modify pivot table you can choose for Fields in the left column of the window. Here you can create or modify the entire pivot table. In the section Type it is also possible to modify settings for rows, columns, filter and data.
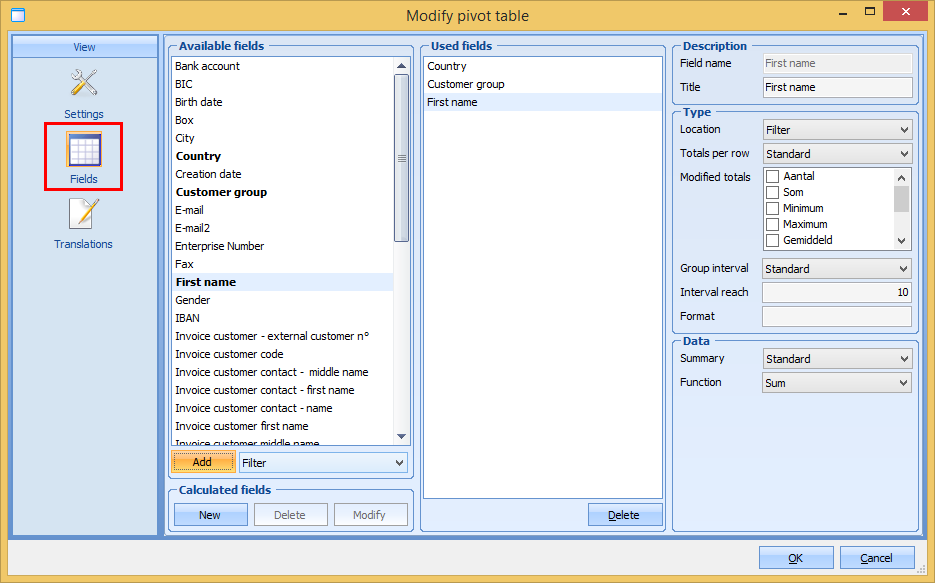 |
In the section Description, you can modify the label of the selected field next to Title.
The field Location in the section Type allows you to determine in which area the selected field has to be placed. Under Totals per row you can determine the way in which the totals have to be calculated; you can choose for the Standard way, for None or for Modified. If you select Modified, you have to make your choice in the section Modified totals. Here you can determine the modified totals. Group interval and Interval reach allow you to define an interval of the selected field.
In the section Data you can determine that you want to visualise the data in another way (as percentages or absolute values) than the default way.
Translations
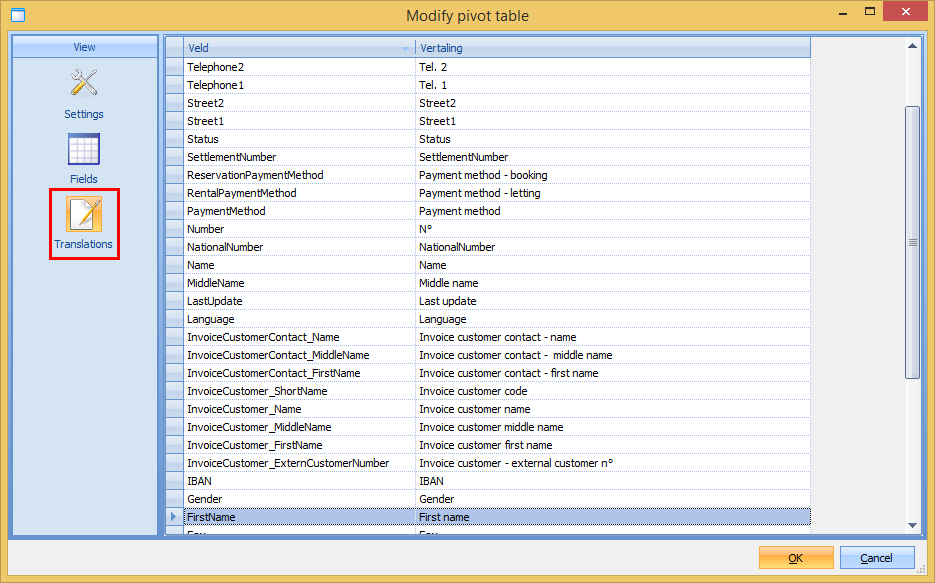
In the window Modify pivot table you can choose for Translations in the left column of the window. Here you can fill in a translation for all available fields. For this purpose, you have to select the available field and fill in a custom text in the column Translation.
 |
Warnung
These translations will be applied to all current and future views.