Quick Tutorial
In principle, the procedure of using pivots is as follows:
Configure Data Source
Configuring data source defines which data you are retrieving from the database to show on your pivot table.
For description on configuring data source, see Configure data source.
Configure Pivot Tables
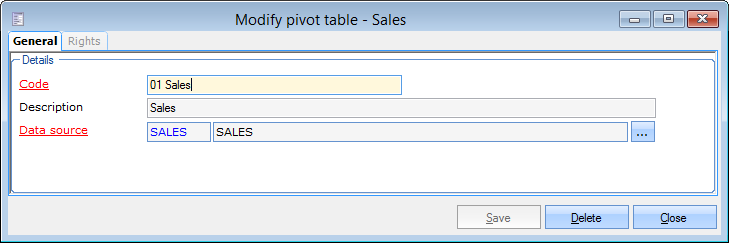
Go to Reporting > Pivot tables > Configure to create a dashboard (F2).
On the tab General, you can configure a code, a description and the data source to be used.
Click Save.
 |
Anmerkung
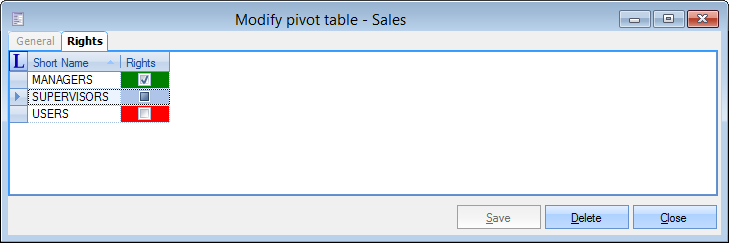
On the tab Rights, you can configure rights to view and/or edit the pivot table for each user group (No access  , read-only
  , full control
  ).
).
 |
Design and View Pivot Table
Set up a pivot table
Place the desired available fields in the correct area of the pivot table by selecting the desired field and dragging it towards the desired area (drag and drop).
 |
See more, Set up a pivot table.
Set up a filter
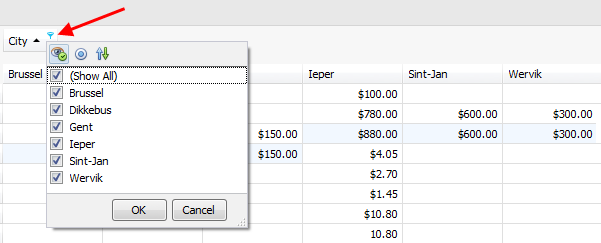
After placing the desired fields in the pivot table, click on the filter icon on a field to set up the filter.
 |
Another way to apply filter is to use the pre-filter from the Filter window, which filters the data before visualising it on the pivot table. This increases the performance.
 |
For more information see, Set up a filter
Click Save in the menu bar to save the configured pivot table.
View pivot table
After setting up the pivot table, disable the design mode from the pivot table menu bar the moment you want to visualise the actual data.
 |
Warnung
It is possible that the data visualised at the time of designing a pivot table is different from what is displayed after disabling the design mode.
It is because when the design more is enabled, only the first 100 records are loaded. This increases performance when configuring the pivot table.
Export a pivot table
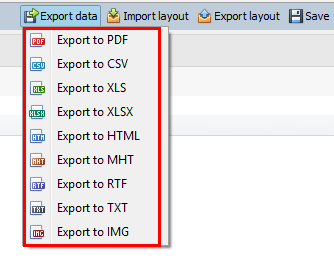
It is possible to export the current pivot table to one of the supported formats (PDF, CSV, XLS, …)
 |