Consult a view
If you want to have a look at a view, it is also advised to respect a number of steps. First, you have to select a view category and a view, and then determine which data you want to call up in the view in the partial window Criteria. The specific criteria that can be used depend on the chosen view category.
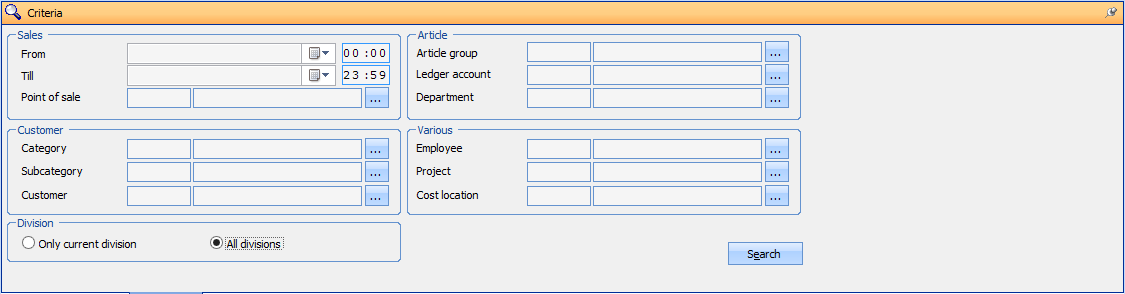 |
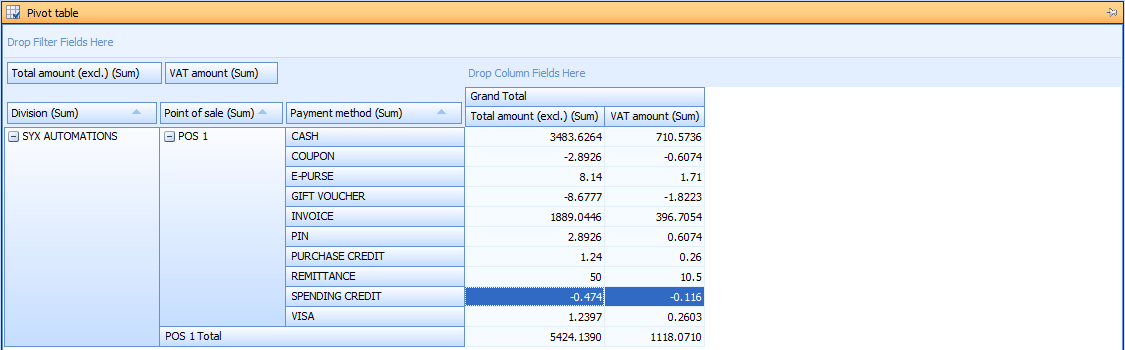
If you click Search you can see the generated data in the partial windows Pivot table, Available fields and Chart.
Warnung
If you do not fill in anything in the criteria, the pivot table will be set up after clicking Search with ALL data available in your database. Dependent on the speed and memory of your computer, this may take quite some time.
Pivot table
A pivot table allows you to organize, summarize and analyse data to clarify their meaning.
 |
If you want to, you can always modify these data. It is for example possible to filter certain data by clicking on the filter button in the row or column area.
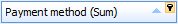 |
You will then be able to select or deselect all rows or columns you want to see or not.
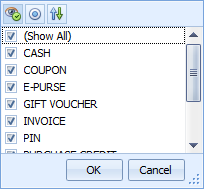 |
Warnung
A filter does not influence the data that is called up from the database. It only has an influence on which data will be included visually in the pivot table.
You can also choose to sort the rows and/or columns in an ascending or descending way by clicking on the arrow next to the filter button.
 |
Table
In the table, you can see all data that are organized, summarized and analysed in the pivot table. Within this table, all functionalities of Recreatex are available.
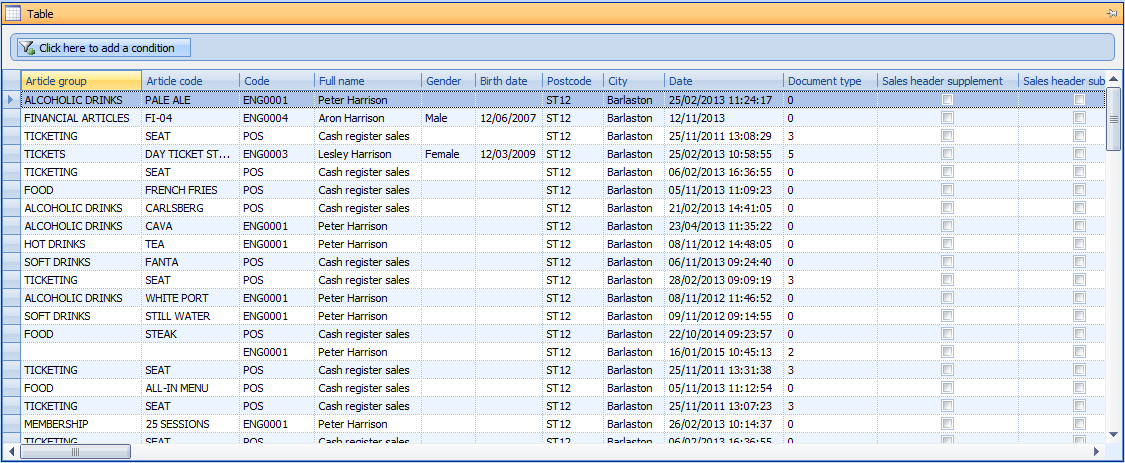 |
If required, you can also apply conditions to this list. You can do this by clicking on Click here to add a condition . Afterwards, you have to set up the desired filter.
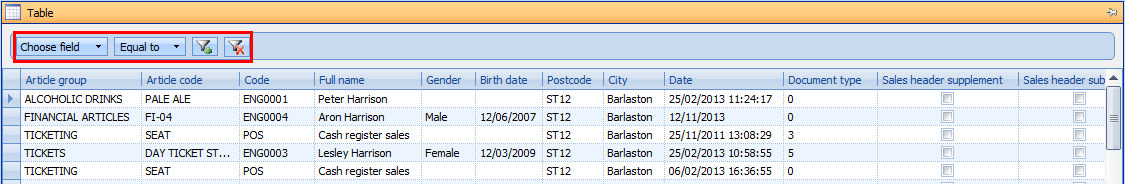 |
Choose field | Choose the fields on which you want to apply the condition. You can select the field by clicking on the arrow after which a list of all available fields will appear. |
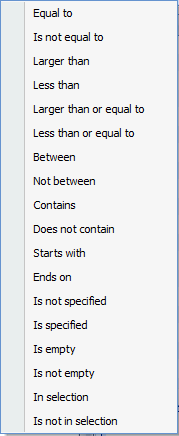
Equal to | Here you can determine the condition for the selected field. You can choose between:
After choosing the condition, you always have to determine with what the system needs to compare.
| ||
| Set up an additional condition. | ||
| Delete the selected condition. |


Warnung
The conditions you can set up here do not influence the pivot table or chart.
Chart
The chart is the visual presentation of the selected data, shown in a rectangular coordinate system.
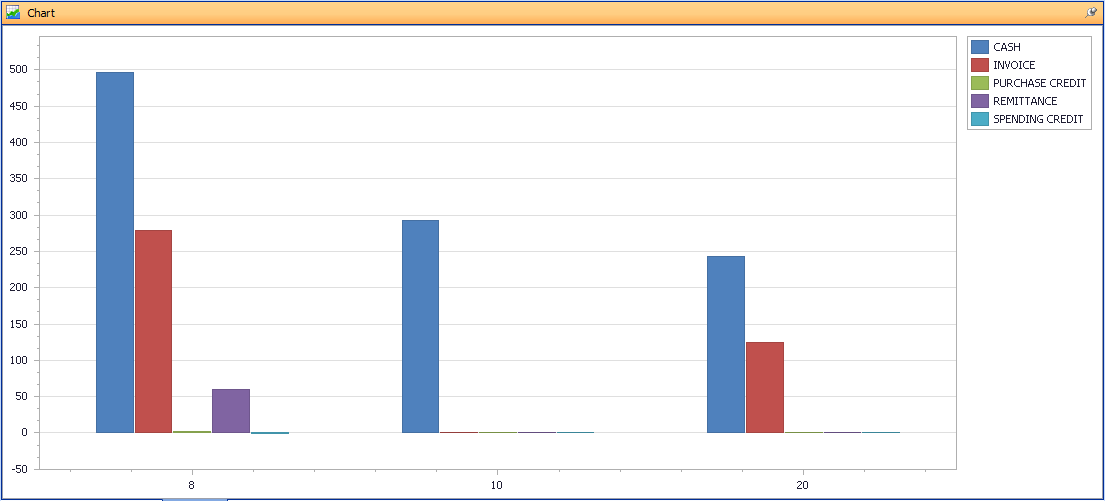 |
Anmerkung
If you make a selection in the partial window Pivot table, only the selected data will be included in the chart.