Dashboard details
On the dashboard details page, you can consult various details related to payment transactions from the tabs Transaction details, Sale point details and Summary.
The dashboard details page allows you certain possibilities to manipulate the data visualisation as well as export and print the data.
Top panel actions
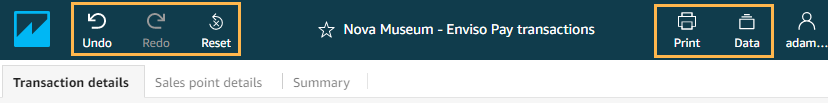 |
Undo/redo and Reset | These buttons allow you to undo/redo your last action. Clicking Reset will remove any filtering parameters applied and revert the default values. |
Allows you to print the data currently on the screen. However to export the data, use chart controls. | |
Data | Allows you to consult the data set that is used for the dashboards. |
Filter data
You can filter the dashboard data based on the available filter parameters. Click the arrow button to expand/collapse the filter controls section. The filtering parameters will differ depending upon the chosen tab.
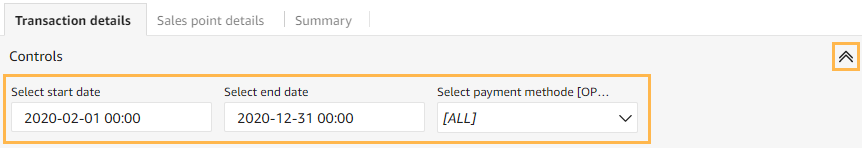 |
Chart controls
Click on a chart card to view its data visualisation controls.
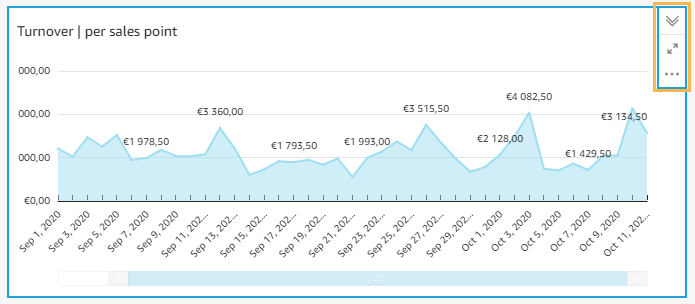 |
Expand/collapse arrows | Allows you to expand/collapse the visualisation control panel. |
Maximize/Minimize | Allows you to maximize/minimize the selected chart/table card. |
More options | Export to CSV: Exports the data to CSV based on the applied filters (if any). Hide +/- buttons: Hides the collapse/expand data buttons in a table chart. Export to Excel: Exports a table chart to Excel based on the applied filters (if any). NoteDepending on the chart type, the options may differ. |
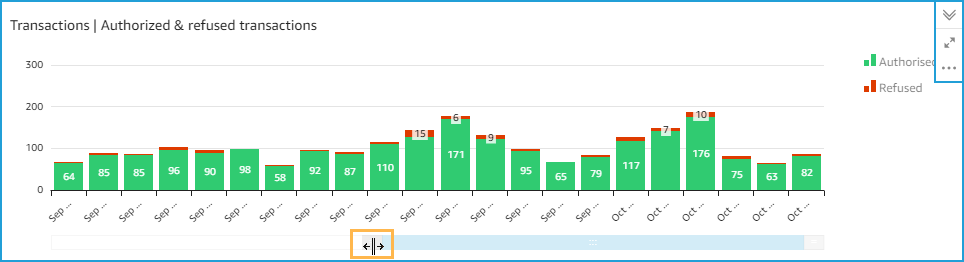
Moreover, for bar or line charts, it is possible to move the slider sideways to zoom in or out of the data over a certain time range.
 |