Troubleshooting
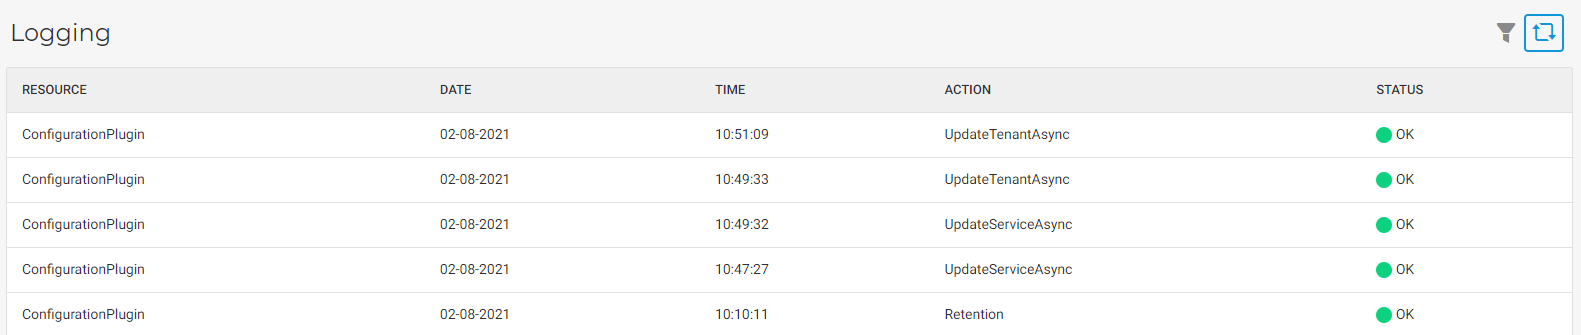
The page logging provides visibility into your Enviso Edge network (which consists of hardware, platform, API, and client). It allows you clear visibility and precise troubleshooting.
Every mode of Enviso Edge logs the activities that take place on the service side. This shows if a terminal is connected correctly or if its activities are interrupted.
Understanding logging status
Almost all plugins check their hardware, API or database status and set it to OK, Failed or Cancelled.
Example: Payment terminal connection OK, Printer status OK, Recreatex database connection OK, etc.
If it cannot be pooled correctly, it will have the status Failed. If connection pooling is cancelled for some reason (payment is starting, the printer must print, etc.), the connection pooling will be cancelled, and its logging status will be set to Cancelled.
Access Agent plugins (GT7, PLC, Cominfo Scanflow,…) will show Access allowed or Access not allowed if a carrier (card) is presented for entrance and the visitor can go in or not.
Access platform plugins (RCXPlatform plugin, Enviso Scan plugin, LPOS platform plugin) will also report Access allowed, Access not allowed.
Agent reader plugins (Proximity reader, barcode reader) will report the status of the read cycle when triggered:
Success - whether a carrier/card has been detected or not
TechnicalProblem - something went wrong in the read cycle)
Payment terminals will report the status of the payment:
TransactionAborted, TechnicalProblem, Success
TransactionAlreadyRunning - if there is another payment running on the device
TransactionRefused - if not allowed. For example, trying to pay with Bancontact when the device does not support Bancontact
TimedOut - the customer did not within the time limit
The Enviso kiosk plugin will log a user sessions activity as:
OK - paid tickets
Payment Cancelled - aborted payment
Session timeout - user goes away
Session Ended manually - user wants to start again
Out of Order - a technical problem occurred
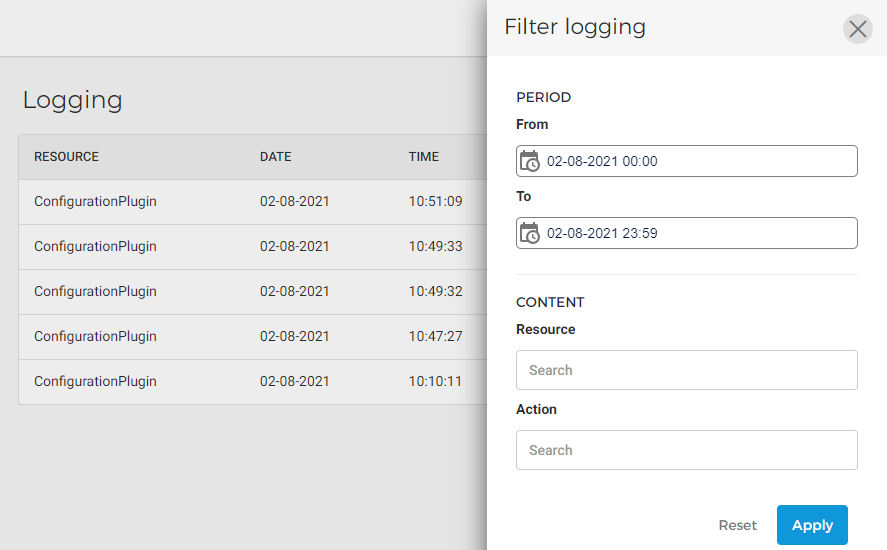
Filter logging details
Click on the filter icon in the top-right of the page. From the resulting side menu, enter the criteria to filter the logging data. Thereafter, click Apply.
Refresh the data
To see the most recently synced data, click on the refresh button  in the top-right corner of the page.
Logging details
Click on a record for which you wish to see the log details.
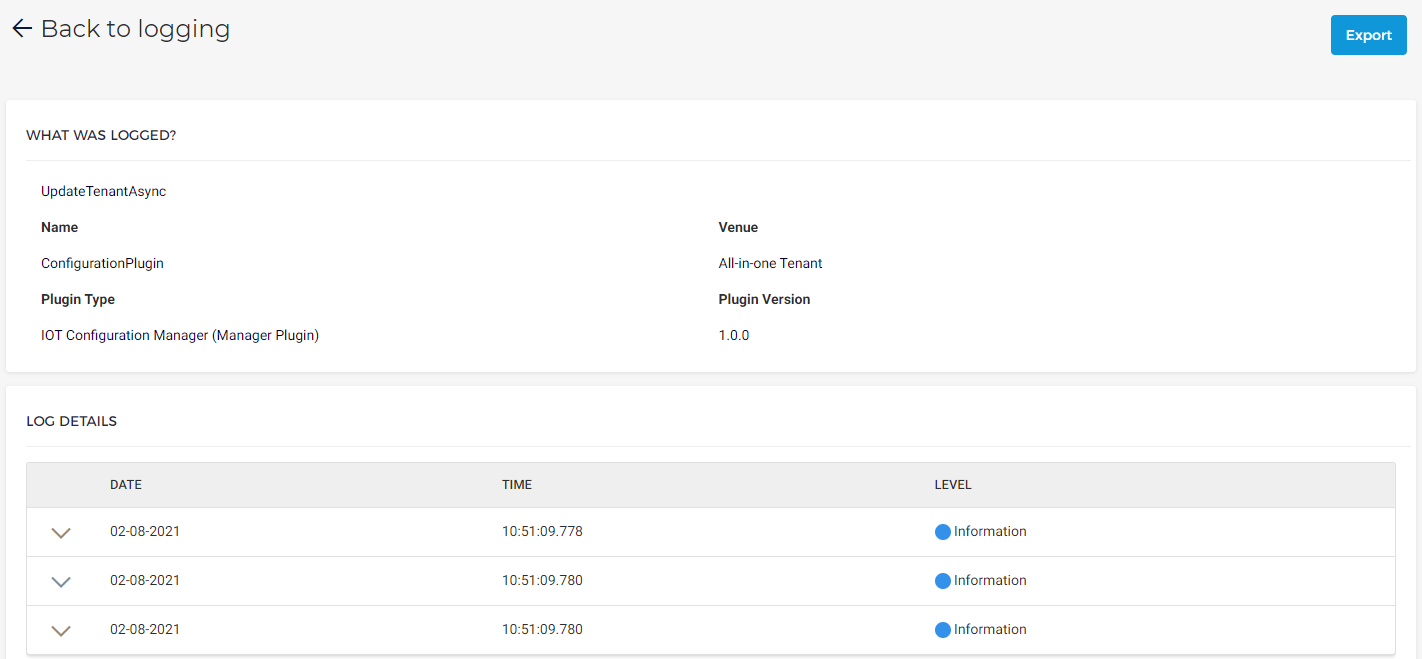
Consulting log details
On the log details page, the table Log details show expandable rows of information
Export logging information
On the log details page, click Export to generate a .json file of the logging details.